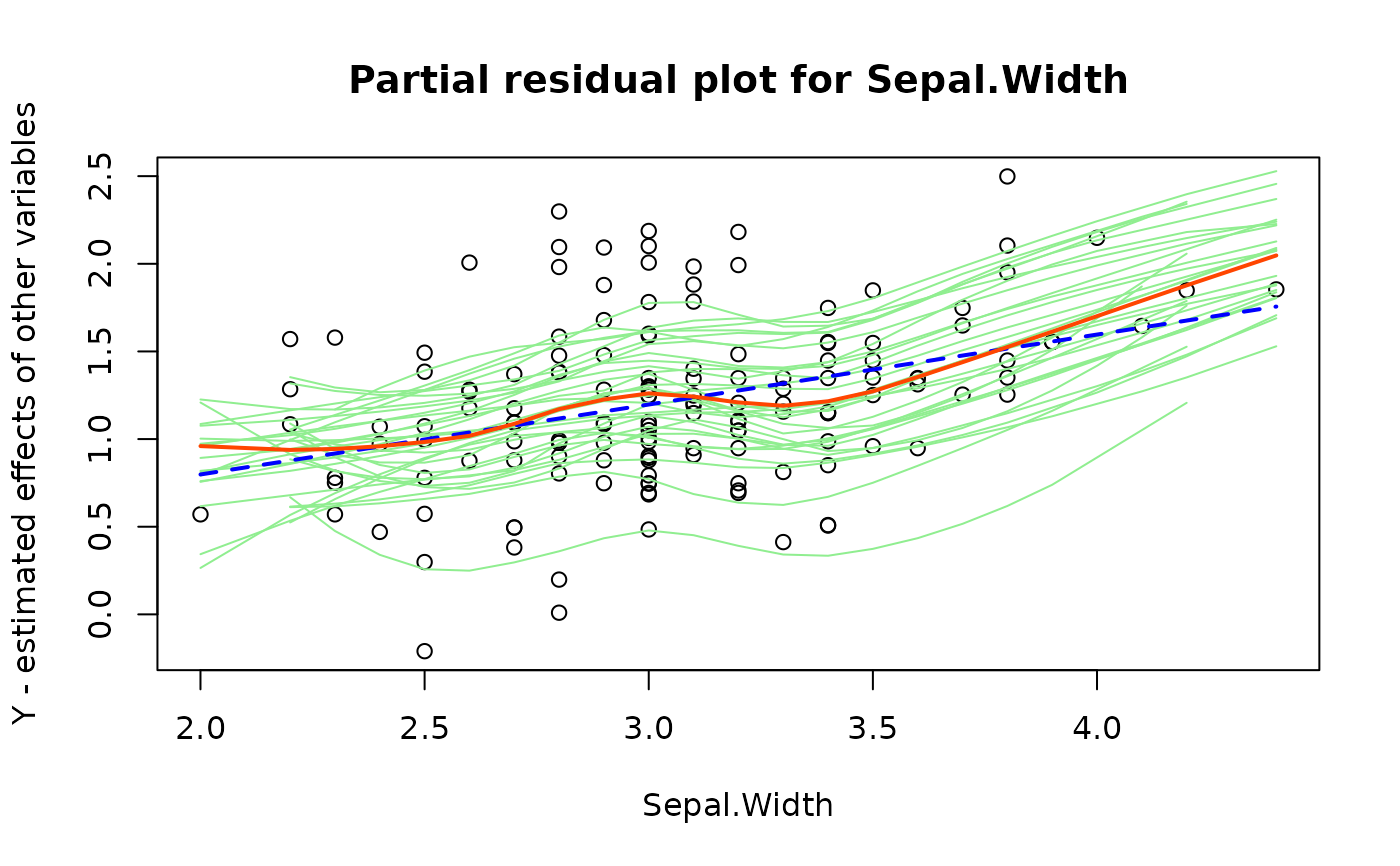
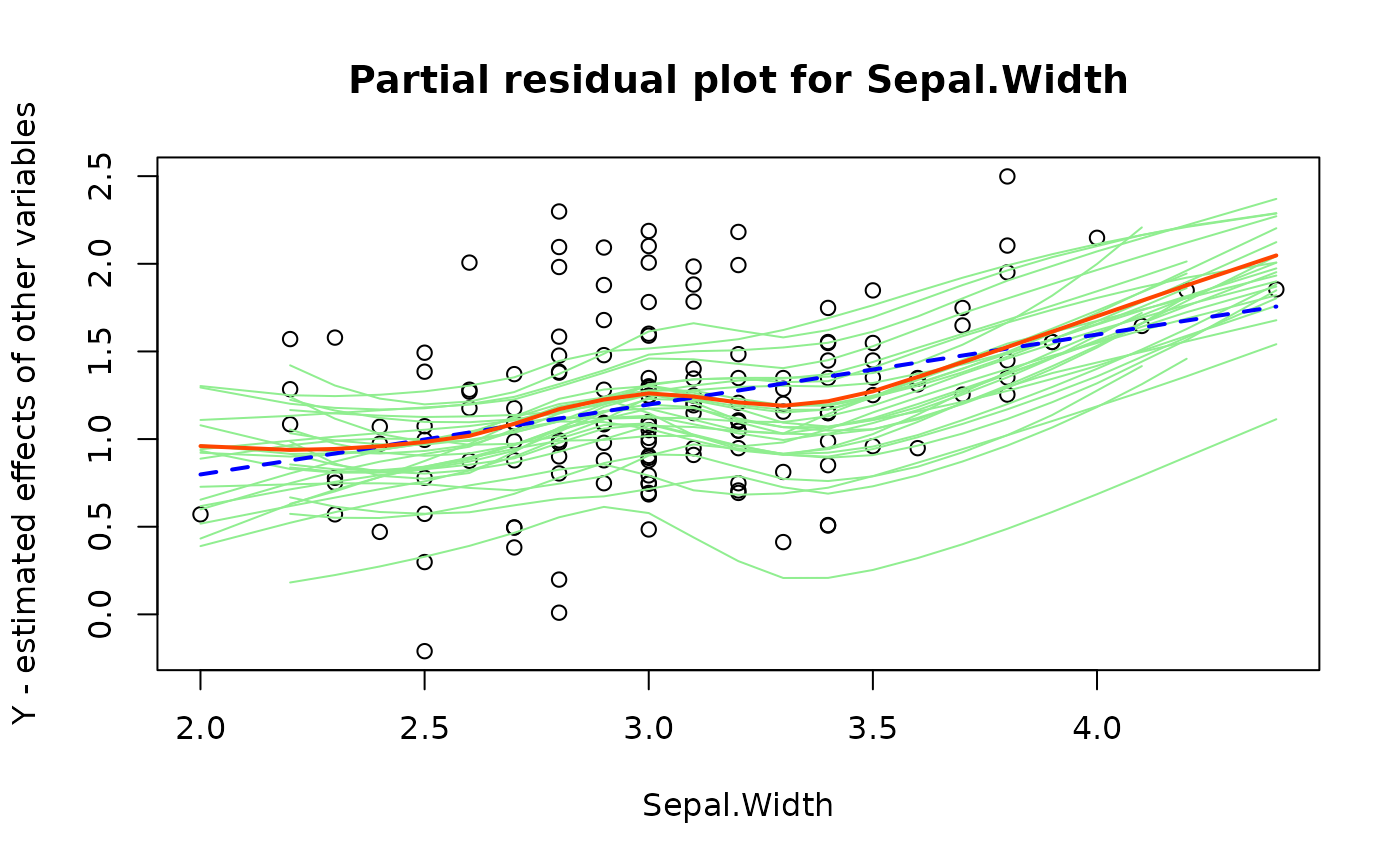
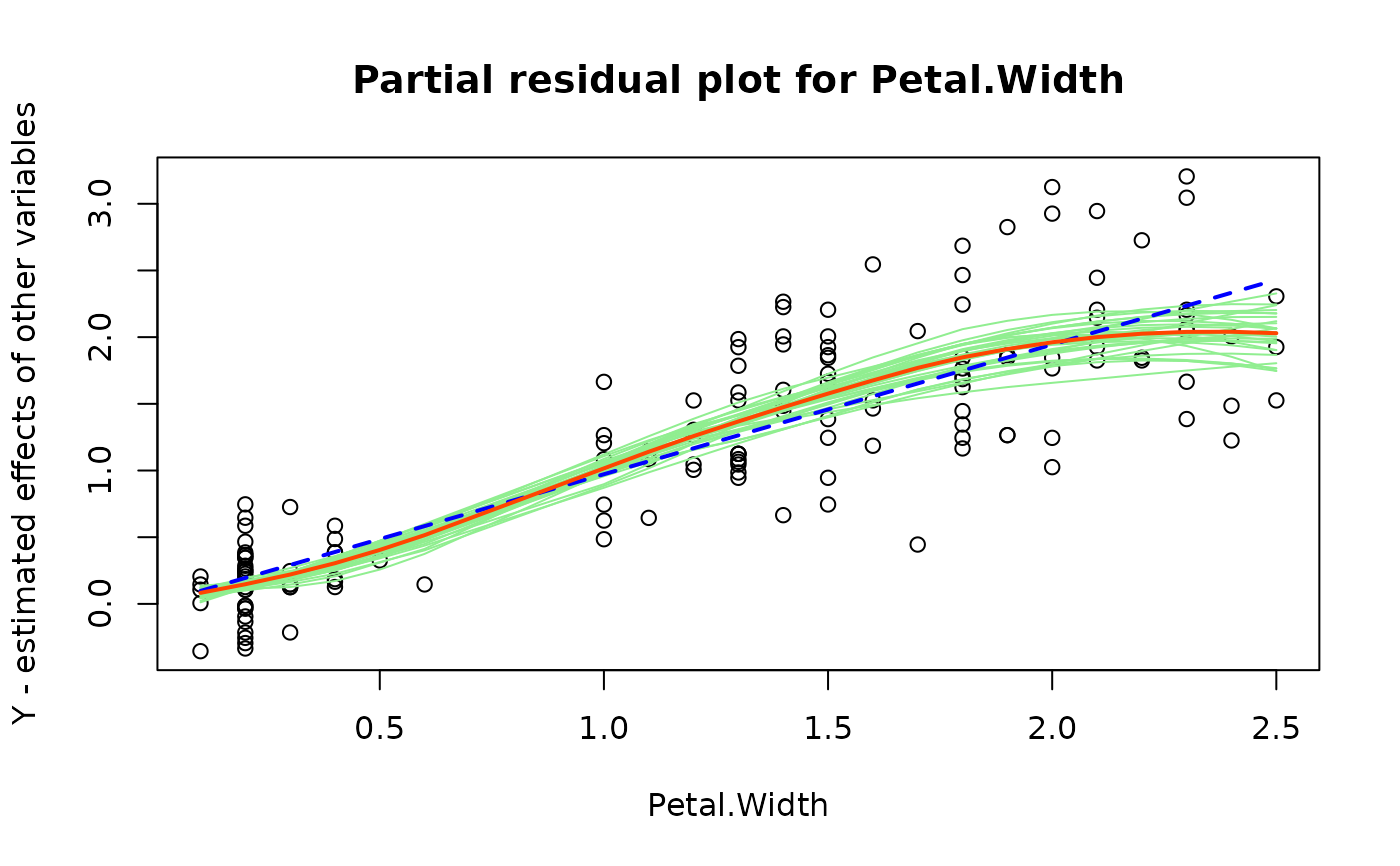
This function draws partial residual plots for a continuous explanatory variables in a given model.
partialResPlot(
  fit,
  varname,
  showBootstraps = nrow(fit$model) >= 30 & nrow(fit$model) < 4000,
  use.inzightplots = FALSE,
  env = parent.frame()
)

allPartialResPlots(fit, ...)
Arguments
- fit
an
lm,glmorsvyglmobject.- varname
character, the name of an explanatory variable in the model
- showBootstraps
logical, if
TRUE, bootstrap smoothers will overlay the graph. By default this isTRUEif there are between 30 and 4000 observations in the model, otherwise it isFALSE.- use.inzightplots
logical, if
TRUE, the iNZightPlots package will be used for plotting.- env
environment where the data is stored for bootstrapping
- ...
additional arguments passed to `partialResPlot`
Value
No return value, called for side-effect of producing a plot.
Functions
allPartialResPlots(): Cycle through all partial residual plots