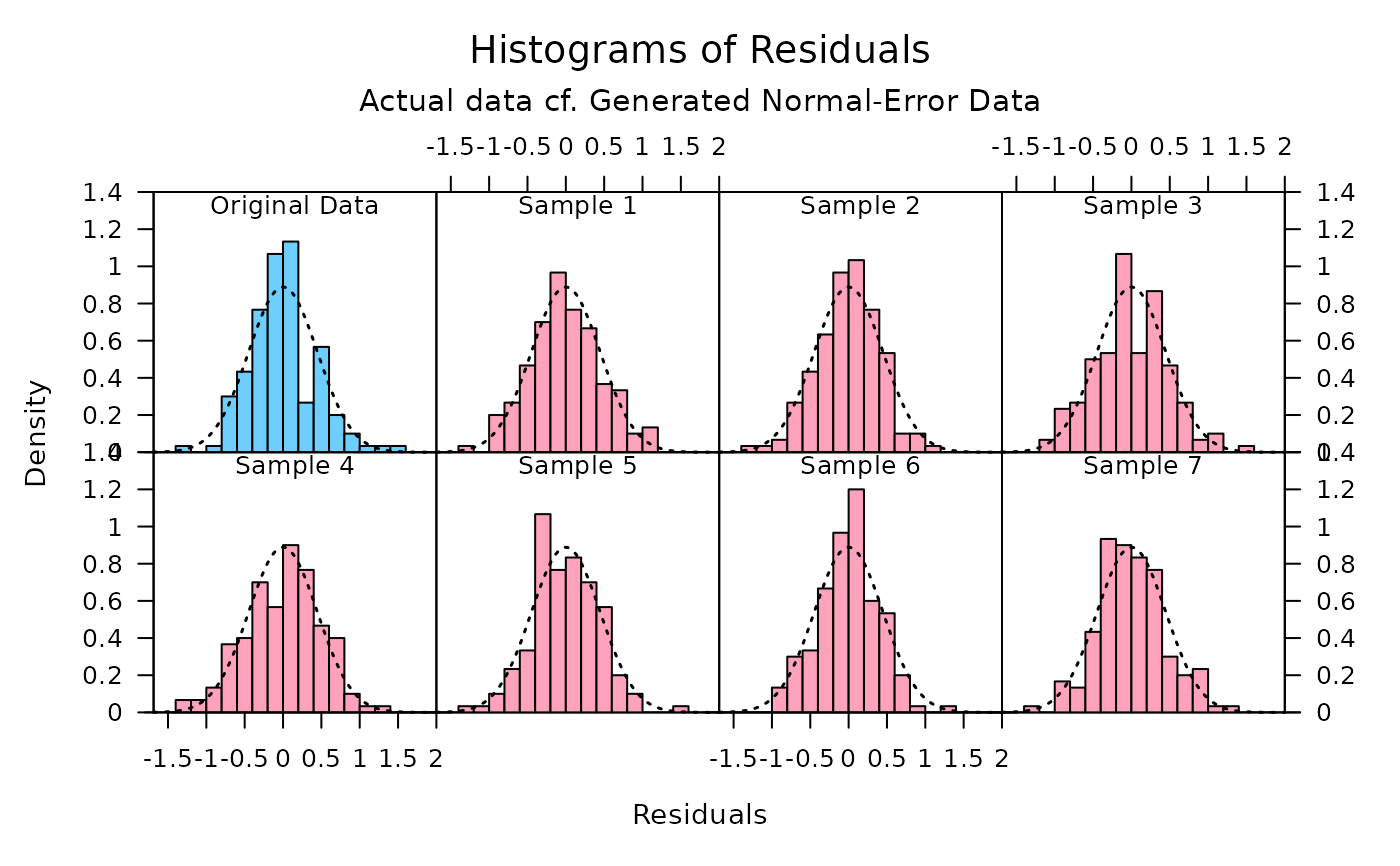
Produces an array of histograms to compare against the histogram of residuals for a fitted linear model.
histogramArray(x, n = 7, env = parent.frame())Arguments
- x
an
lmorsvyglmobject.- n
the number of additional histograms to plot alongside the original.
- env
environment for finding data to bootstrap
Value
No return value, called to generate plot.
Details
The histogram of the model x appears in the top-left
position. For each of the other histograms, the fitted values of
x are taken and normal random errors are added to these. The
normal residual standard errors have standard error equal to the
estimated residual standard error of x. A model is then fitted
to this altered data and a histogram is produced.
See also
Examples
histogramArray(lm(Sepal.Length ~ Sepal.Width + Species, data = iris))
